A REVIEW ON CAPILLARY ELECTROPHORESIS
ABSTRACT
Capillary electrophoresis is a rapidly developing set of combining techniques that can be used to a wide range of molecules and sample types. Automation is made possible by the capillary format, which offers quick and extremely effective separations.
There is more work to be done on improving detection techniques and developing systematic ways to separation methodology. Without a question, in some circumstances, capillary tube electrophoresis will replace HPLC. This is particularly noticeable when the most important factors are analysis time, efficiency, or simplicity. In biotechnology, capillary electrophoresis will be very helpful in the separation of proteins and nucleotides for analytical purposes. Lastly, capillary electrophoresis is perfect for developing separations-based sensors for microenvironment analysis since it can be used with ultrasmall-volume samples. Keywords: Automation, Biotechnology, Nucleotides, Detection techniques. INTRODUCTION Even since its initial presentation in 1981 [1], capillary electrophoresis (CE) has advanced significantly into a reliable and sophisticated separation method [2]. The advantages of CE over conventional separation methods, such as gel electrophoresis and liquid chromatography, are great setup and miniaturization simplicity, quick separation with good resolution and efficiency, and low sample and solvent consumption. As a result, CE has been widely used to separate a variety of analytes, including tiny ions, macromolecules, and microbes, in biomedical research, criminal investigations, environmental monitoring, food quality evaluation, etc.
CAPILLARY ELECTROPHORESIS (CE)
It is a class of electrokinetic separation techniques carried out in micro- and nanofluidic channels as well as capillaries with submillimeter diameters. It is a class of electrokinetic separation techniques carried out in micro- and nanofluidic channels as well as capillaries with submillimeter diameters. PRINCIPLE A capillary is used as a separation channel while an electric field is applied in capillary electrophoresis, a liquid-based separation method. In this analytical method, charged ions are separated by the electroosmotic flow. It can be used in many different contexts, such as coenzyme separation, DNA analysis, chemical compound analysis, and protein identification.
THEORY OF CAPILLARY ELECTROPHORESIS
The term “CE” is frequently used to refer to capillary zone electrophoresis (CZE), however this class of techniques also includes capillary gel electrophoresis (CGE), capillary isoelectric focusing (CIEF), capillary isotachophoresis, and microscale electrokinetic chromatography (MEKC).[1]Analytes move through electrolyte solutions in CE techniques when an electric field is applied. Analytes can be divided based on their ionic mobility or by using non-covalent interactions to partition into a different phase. Analytes can also be “focused” or concentrated using gradients in pH and conductivity. Tools

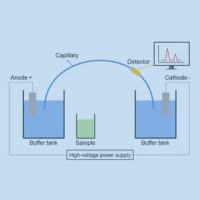
Figure 1: Diagram of capillary electrophoresis system
Capillary electrophoresis requires relatively simple instrumentation. Figure 1 depicts the basic layout of a capillary electrophoresis apparatus. A sample vial, source and destination vials, electrodes, a capillary, a high voltage power supply, a detector, and a data output and handling device are the major parts of the system. Aqueous buffer solution is used as the electrolyte and is filled into the capillary, source vial, and destination vial. To introduce the sample, the capillary inlet is placed into a vial containing it. By using capillary action, pressure, siphoning, or electrokinetics, the sample is loaded into the capillary and subsequently returned to the source vial. The equipment needed for capillary electrophoresis is quite simple. The fundamental design of a capillary electrophoresis device is shown in Figure 1.
The main components of the system are a sample vial, source and destination vials, electrodes, a capillary, a high voltage power supply, a detector, and a data output and handling device. The electrolyte, aqueous buffer solution, is put into the capillary, source vial, and destination vial. To introduce the sample, the capillary inlet is placed into a vial containing it. By using capillary action, pressure, siphoning, or electrokinetics, the sample is loaded into the capillary and subsequently returned to the source vial. The equipment needed for capillary electrophoresis is quite simple. The fundamental design of a capillary electrophoresis device is shown in Figure 1.
A data output and handling device, for instance, are the main components of the system. detector response as a function of time, is then displayed using the data. In an electropherogram, distinct chemical substances show up as peaks with varying migration times.[2] James W. Jorgensen and Krynn DeArman Lukacs are frequently credited with developing the approach and demonstrating its potential.[3] Richard D. Smith and associates were the first to combine capillary electrophoresis with mass spectrometry, which offers incredibly high sensitivity for the study of very small sample quantities. Despite the very small sample sizes (typically only a few nanoliters of liquid are introduced into the capillary), high sensitivity and sharp peaks are achieved in part due to injection strategies that result in a concentration of analytes into a narrow zone near the inlet of the capillary. This is achieved in either pressure or electrokinetic injections simply by suspending the sample in a Field-
amplified sample stacking, a type of isotachophoresis, concentrates the analyte in a small area at the intersection of the higher-conductivity running buffer and the low-conductivity sample.
Instruments having arrays of capillaries are used to evaluate multiple samples at once in order to increase sample throughput. For medium- to high-throughput capillary DNA sequencing, such capillary array electrophoresis (CAE) devices with 16 or 96 capillaries are utilized. The capillaries’ input ends are arranged spatially to accept samples straight from SBS-standard footprint 96-well plates. The basic concepts of design and operation are identical to those illustrated in Figure 1, although some aspects of the instrumentation (such detection) are inevitably more sophisticated than for a single-capillary system.
DETECTION
Several detection tools are available to identify separation by capillary electrophoresis. The principal mechanism of detection in most commercial systems is UV or UV-Vi’s absorbance. The detection cell in these systems is a portion of the capillary itself. Analytes that have been separated can be detected by on-tube detection without sacrificing resolution. For greater flexibility, capillaries used in capillary electrophoresis are typically coated with a polymer (usually Teflon or polyimide). However, the capillary section that is utilized for UV detection needs to be optically clear. In polyimide-coated capillaries, a few millimeters of exposed glass are usually created by burning or scraping off a portion of the covering. This capillary’s exposed portion is brittle, and capillaries coated with transparency. In capillary electrophoresis, the detection cell’s path length (about 50 micrometers) is much shorter than a conventional UV cell’s (about 1 cm). The detector’s sensitivity is proportional to the cell’s path length, as stated by the Beer-Lambert law. The path length can be extended in order to boost sensitivity, however doing so reduces resolution. As seen in figure 2, more tubing can be added at the detecting site, or the capillary tube itself can be enlarged to create a “bubble cell” with a longer route length. However, the resolution of the separation will be reduced by both of these approaches.[4] If the wall of a capillary develops a smooth aneurysm, this drop is essentially undetectable.
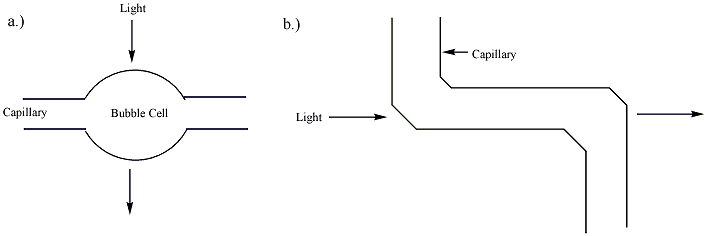
Figure 2: Techniques for increasing the pathlength of the capillary: a) a bubble cell and b) a z-cell (additional tubing).[2]
When samples are chemically altered to incorporate fluorescent tags or fluoresce naturally, fluorescence detection can also be utilized in capillary electrophoresis. For these samples, this mode of detection provides excellent sensitivity and enhanced selectivity; nevertheless, it is not applicable to samples that lack fluorescence. Fluorescent derivatives or conjugates of non-fluorescent materials, such as proteins and DNA, are made using a variety of labelling techniques. A capillary electrophoresis system’s fluorescence detection setup can be challenging. It can be challenging for many light sources to focus the light beam on the capillary as required by the procedure.[4]It has been possible to use laser-induced fluorescence in CE systems with detection limits as low as 10−18 to 10−21 mol. The extreme intensity is responsible for the technique’s sensitivity. and 5-color LIF detection devices are frequently employed in genotyping (also known as “DNA fingerprinting”) and capillary DNA sequencing applications.
Capillary electrophoresis can be immediately connected with mass spectrometers or Surface Enhanced Raman Spectroscopy (SERS) to determine the identity of sample components. The capillary exit is typically connected to an electrospray ionization (ESI) ion source in these systems. The mass spectrometer then examines the resultant ions. The variety of separation modes that can be used and the level of resolution that can be attained will be impacted by this setup’s requirement for volatile buffer solutions.[4]Most of the measuring and analysis is carried out using a specialized tool. capillary electrophoresis, analyte retention periods can be converted into spatial distance by moving the SERS-active substrate at a steady pace. This makes it possible to identify some eluants with great sensitivity using the spectroscopic technique that follows. It is possible to select SERS-active substrates that don’t affect the analytes’ spectra.
METHODS OF DISCONNECTION
Analytes migrate differently in an applied electric field, which is necessary for the separation of substances using capillary electrophoresis. An analyte’s electrophoretic migration velocity toward the electrode with the opposite charge is:
The migration time and field strength can be used to experimentally estimate the electrophoretic mobility There are the following measured values: the length of the capillary overall, the applied voltage (field strength), the migration time (the amount of time the analyte takes to reach the detection site), and the distance from the intake to the detection point.[4] Neutral analytes are not well separated by capillary electrophoresis because the electric field primarily affects charged ions. The rate of electroosmotic flow (EOF) of the buffer solution in capillary electrophoresis will also affect the migrating velocity of an analyte. In a standard setup, the buffer moves from the source vial to the destination vial via the capillary with the electroosmotic flow oriented toward the negatively charged cathode. Analytes migrate toward the electrode with the opposite charge when they are separated by different electrophoretic mobilities.[2]

Figure 3: Diagram of the separation of charged and neutral analytes (A) according to their respective
Electrophoretic and Electroosmotic flow mobilities All analytes are carried toward the cathode with the buffer solution because the electroosmotic flow of the buffer solution is typically larger than the electrophoretic mobility of the analytes. The comparatively strong EOF of the buffer solution can guide even small, triply charged anions to the cathode. Because of their opposing electrophoretic mobilities, negatively charged analytes are kept in the capillary for extended periods of time.[2] Figure 3 illustrates the migration order seen by the detector: small multiply charged anions are strongly held while small multiply charged cations travel swiftly.[4]
When an electric field is supplied to a solution in a capillary with fixed charges on its inner wall, electroosmotic flow is seen. Placing a buffer solution within a capillary causes charge to build up
on its inner surface. When the pH level in a fused-silica capillary is higher than three, silanol (Si-OH) groups that are affixed to the inner wall of the capillary ionize to negatively charged silanoate (Si-O−) groups. Before adding the buffer solution, the capillary might be initially filled with a basic solution, like NaOH or KOH, to improve the ionization of the capillary wall. The positively charged cations in the buffer solution are drawn to the negatively charged silanoate groups, forming two inner layers of cations that are referred to as theBecause the first layer is firmly bonded to the silanoate groups, it is known as the fixed layer. The mobile layer, which is the outermost layer, is located further away from the silanoate groups. When an electric field is provided, the mobile cation layer is drawn toward the negatively charged cathode. The bulk buffer solution migrates with the mobile layer due to the solubility of these cations, resulting in the buffer solution’s electroosmotic flow. There is electroosmotic flow in other capillaries as well, such as Teflon capillaries. The electrically charged ions of the buffer adsorbing onto the capillary walls is most likely the cause of the EOF of these capillaries.[2] The capillary wall’s charge density and field strength affect the rate of electroosmosis. The wall’s

Figure 4: Depiction of the interior of a fused-silica gel capillary in the presence of a buffer solution.
The inner surface of the capillary can be coated with polymers, surfactants, or small molecules in specific circumstances where strong electroosmotic flow toward the cathode is undesirable. This will reduce electroosmosis to very low levels and restore the normal direction of migration (anions toward the anode, cations toward the cathode). Reversible polarity power supply is a common feature of CE instrumentation, enabling the operation of the same instrument in “normal” mode. (with EOF and detection close to the capillary’s cathodic end) and “reverse” mode (EOF suppressed or reversed, and detection close to the capillary’s anodic end). According to Stellan Hjertén’s 1985 research, one of the most popular methods for EOF suppression is to apply a layer of linear polyacrylamide covalently.[8] The capillary’s silica surface is first altered using a silane reagent that has a polymerizable vinyl group (such as 3-methacryloxypropyltrimethoxysilane), and then acrylamide monomer and a free radical initiator are added. Long linear chains of acrylamide are formed during in situ polymerization, some of which are covalently bonded to the wall-bound silane reagent. There is a plethora of alternative methods for covalently altering capillary surfaces. Coatings that are dynamic or adsorbed, such as polymers or tiny.
Efficiency and resolution
In capillary electrophoresis, the number of theoretical plates, or separation efficiency, is determined by: where is the analyte’s diffusion coefficient, is the apparent mobility in the separation medium, and is the number of theoretical plates. This equation states that the strength of the electric field determines the effectiveness of separation, which is proportional to the electric field strength and only limited by diffusion. However, practical limitations restrict the electric field strength to several hundred volts per centimeter. Applying potentials that are too high (>20–30 kV) might cause capillary breakdown or arcing. Furthermore, the buffer in the
capillary heats resistively, or Joule heating, when large electric fields are applied. This heating is potent enough that, at high enough field strengths, radial temperature gradients can the Ohm’s Law plot). Smaller capillaries typically allow for the use of higher field strengths because they have better heat dissipation and smaller thermal gradients than larger capillaries. However, because of their shorter paths, smaller capillaries have lower absorbance detection sensitivity and are more difficult to introduce buffer and sample into because they require more pressure and/or longer times to force fluids through. Compared to other separation methods like HPLC, capillary electrophoresis separations usually have substantially better separation efficiencies. There is no mass transfer between phases in capillary electrophoresis, in contrast to HPLC.[4] Furthermore, as can be seen in figure 5, the pressure-driven flow in chromatography columns has a rounded laminar flow profile, but the flow profile in EOF-driven systems is flat. As a result, unlike in pressure-driven chromatography, EOF has little effect on band broadening. Several hundred thousand theoretical plates can be used for capillary electrophoresis separations. This equation states that maximum resolution is reached when the electrophoretic and electroosmotic mobilities are similar in magnitude and opposite in sign. It also shows that high resolution necessitates lower velocity and, consequently, increased analysis time.[4] In addition to the previously discussed effects of diffusion and Joule heating, other factors that may reduce the resolution in capillary electrophoresis from the theoretical limits in the above equation include interactions between the analyte and the capillary wall, finite widths of the injection plug and detection window, analyte-capillary wall interactions, instrumental non-idealities like a slight difference in height of the fluid reservoirs leading to siphoning, and irregularities in the electric field due to, for example, imperfectly cut capillary.
CAPILLARY ELECTROSEPARATION METHODS
Capillary zone electrophoresis (CZE), capillary gel electrophoresis (CGE), micellar electrokinetic capillary chromatography (MEKC), capillary electrochromatography (CEC), capillary isoelectric focusing (CIEF), and capillary isotachophoresis (CITP) are the six capillary electroseparation methods that are currently available. As seen in Figure 3, they can be divided into continuous and discontinuous systems. A background electrolyte functions as a buffer throughout the capillary in a continuous system. This can be divided into two categories: steady-state (changing electrolyte content) and kinetic (constant electrolyte composition). The sample is maintained in discrete zones divided by two different electrolytes using a discontinuous method.Six
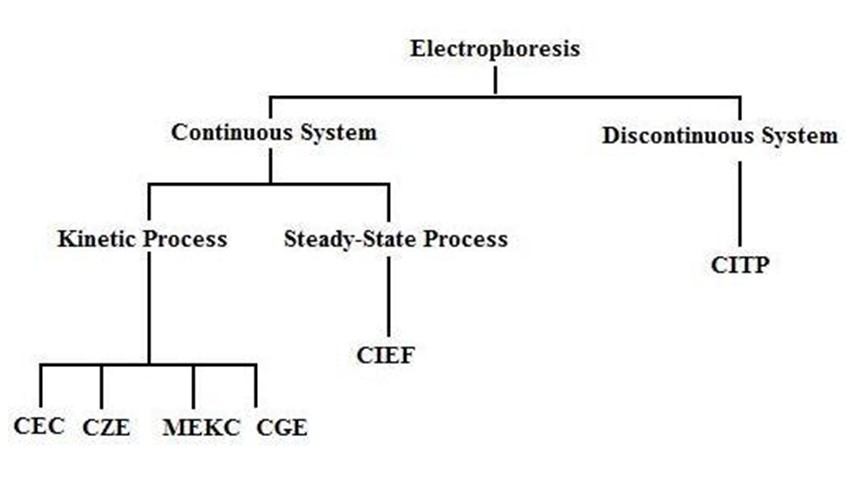
Chart 1: Categorization of Electrophoresis Techniques
Electrophoresis of the Capillary Zone (CZE)
Of the six techniques, capillary zone electrophoresis (CZE), also referred to as free solution capillary electrophoresis, is the one that is most frequently employed.It is simple and rapid to separate a mixture into its constituent parts in a solution.The electrophoretic mobility, which is inversely proportional to the solvent viscosity and atomic radius and directed according to the molecule’s charge, is the basis for separation.The electrophoretic mobility and the strength of the electric field are closely correlated with the ion’s speed.1.
The silicon groups in the fused silica capillaries ionize in the buffer. Positively charged cations are drawn to the negatively charged SiO-ions and separate into two layers: a stationary cation layer and a diffuse cation layer.
In Gel Electrophoresis in Capillaries (CGE)
As the particles move through the gel, CGE uses separation based on the variation in solute size. Gels are helpful because they reduce heat transfer by slowing down the molecules, minimize solute diffusion, which results in zone broadening, and stop the solute from being absorbed by the capillary walls. Capillary SDS-PAGE is a gel device that is frequently used to separate proteins. It just needs a tiny quantity of material and is an extremely sensitive system.1.
MEKC stands for micellar electrokinetic capillary chromatography.
The basis of the MEKC separation method is the solutes’ partitioningbetween micelles and the solvent. Micelles, which are formed when a surfactant is introduced to a solution over the critical micelle concentration, are clumps of surfactant molecules. Because of their polar negatively charged surfaces, the aggregates are drawn to the positively charged anode by nature. The micelles are also drawn to the cathode, albeit more slowly, due to the electroosmotic flow in that direction.Hydrophilic molecules will move through the solvent more quickly than hydrophobic molecules, which will spend most of their time in the micelle. Neutral molecules will migrate with the electroosmotic flow in the absence of micelles, preventing separation. When micelles are present, the outcome is
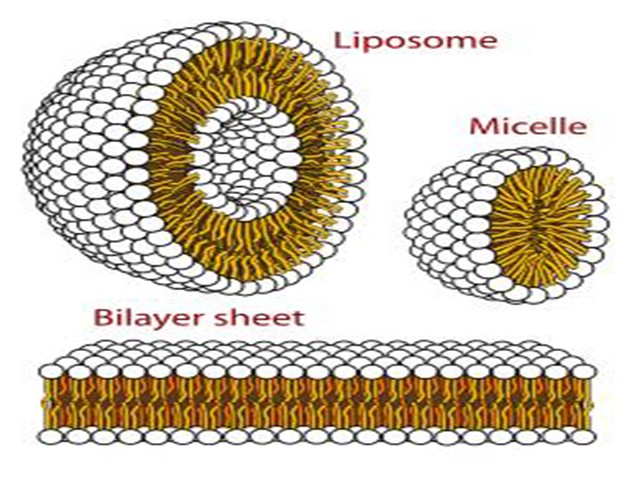
Figure 5: Micelles.
Electrochromatography Capillary (CEC)
A packed column resembling a chromatography column serves as the separating mechanism. The particles and the silica wall are traversed by the mobile liquid. The charges on the stationary surface generate an electroosmosis flow. The plug-type flow that CEC and CZE have in contrast to the pumped parabolic flow that broadens the band is what makes them similar.1.
CIEF, or capillary isoelectric focusing
Proteins and peptides can be separated using the CIEF approach. Because these molecules have both positive and negative charges, they are referred to as zwitterionic compounds. The functional groups affixed to the main chain and the pH of the surrounding environment determine the charge. Every molecule also has a unique isoelectric point (pI). The molecule has no net charge when the pH of the environment is the same as this pI. To be explicit, it is the pH value at which positive and negative charges cancel out to zero, not the pH at which a protein has all bases deprotonated and all acids protonated. The molecule is positive at pH values below the pI and negative at pH values above the
Calculating pI
An amino acid’spI, which is equal to (pK1+pK2+…+pkn)/n, is equal to the average group pkas for an amino acid with n ionizable groups and their associated pKa values, pK1, pK2,…, pkn. In addition to their amino and carboxy terminal groups, most proteins also feature a considerable number of ionizable sidechains. Every protein has an individual pI, which, provided we know the amino acid makeup of the protein, can be theoretically calculated using the Henderson-Hasselbalch approach. 2-Dimensional Electrophoresis (2-DE) can be used to experimentally determine the pI of a protein. After being added to a pH-immobilized gradient strip, the proteins from a cell lysate migrate to the strip’s pI during electrophoresis. The separation of proteins by MW using an SDS-gel constitutes the second dimension of 2-DE.
Capillary Isotachorphoresis (CITP)
In a discontinuous system, CITP is the sole approach that should be applied. The analyte migrates in successive zones, and the amount of sample present can be determined by measuring the length of each zone.1.
Capillary Electrophoresis versus High Performance Liquid Chromatography (HPLC)
1. In contrast to the pumped parabolic flow of the HPLC, the CE has a flat flow. Narrower peaks and improved resolution are the outcome of the flat flow (Figure 44).
2. Compared to HPLC, CE has a higher peak capacity since it employs millions of theoretical plates.
3. HPLC is more advanced and offers a wide range of deployable mobile and stationary phases.
4. While CE is easier for the user to use, HPLC contains more sophisticated instrumentation.
5. Whereas CE is restricted to narrow capillaries, HPLC offers a vast range of column lengths and packing arrangement options.
6. Both methods make use of comparable detecting modalities.
7. Suitable for complementing use with each other
INSTRUMENTATION
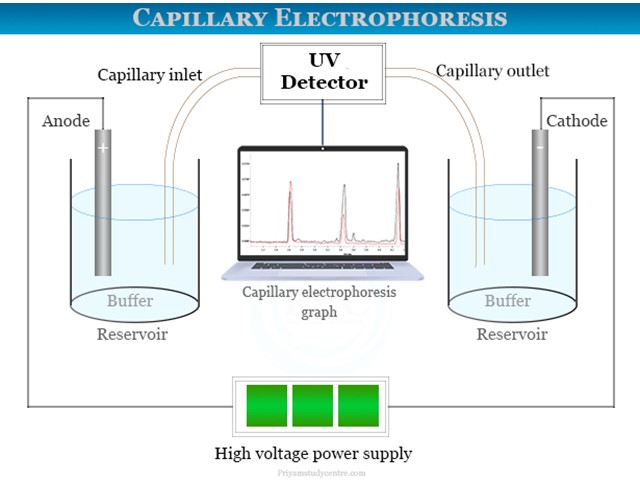
Figure 6: Instrumentation capillary electrophoresis
A capillary electrophoresis apparatus can examine materials at 10−9 nanolevels with a detection sensitivity of 10−18 nanolevels. According to this theory, charged species are divided according to differences in ionic mobility or migration rates when subjected to an electric field. CZE also separates inorganic cations such as magnesium, sodium, potassium, and lithium ions.
Capillary electrophoresis instrument
An electrophoresis equipment with a detector added is essentially the same as a capillary zone electrophoresis (CZE) apparatus. A fused silica capillary tube (10 to 100 μm) with an appropriate electrolyte inside serves as the separating medium.
One end of the capillary was filled with the sample volume, while the other end was submerged in buffer solution. With a potential of between 1000 and 30,000 volts, a high voltage current is provided to the capillary zone electrophoresis apparatus.
Detector
The technique is often carried out using an ultraviolet-visible absorption kind of detector. A photomultiplier tube is connected to an optical fiber, which allows a concentrated laser beam to flow through. The extremely short route length of 10 to 100 μm makes sensitive detection feasible. Data from the detector can be transferred to an output device, like a computer or integrator. An electropherogram, which is shown above the image, can be used to depict the data that the detector sent. For samples that naturally glow, capillary electrophoresis devices can also use fluorescence detection. For instance, fluorescence detection was utilized in DNA sequencing.
Fused silica capillaries
An ionizable silanol group is employed with fused silica capillaries. SiOH generates a negative charge on the capillary surface at pH scale 2.0. We refer to it as zeta-potential. It uses a high voltage electric current to form a double layer for cation buildup. Positive charges travel in the direction of the electrode or cathode during capillary electrophoresis. The passage of these cations is facilitated by the buffer. All of the ions from the analytical sample flow in a single direction as a result. The rate of electroosmotic flow of buffer solution determines the velocity of sample migration in fused silica capillaries.
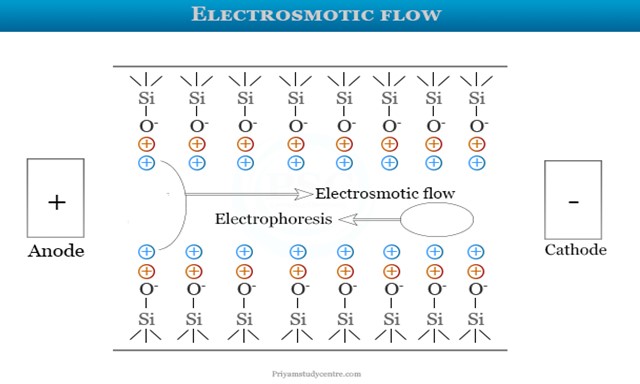
Figure 7: Electrosmotic flow
A fixed layer is the first layer seen in the image above. It has a strong bond with the silanol group. A silanol group is further formed by the outer layer, also referred to as the mobile layer. The cations on the mobile layer move to the negatively charged cathode when an electric field is applied. It triggers the buffer solution’s electroosmotic flow. The majority of positive ions are found first, while the negative ions are found later. This method makes it simple to separate and examine DNA, RNA, and an 18-amino acid combination. Chromatographic distribution is not involved. As a result, macromolecule separation uses it.
RECENT DEVELOPMENT IN CAPILLARY ELECTROPHORESIS
The main challenges facing CE have been continually addressed, including low concentration sensitivity and strong wall adsorption of large molecular mass or unfavourable charges [4], which can be especially troublesome when using CE to analyse complex samples with high concentrations of interfering compounds in the matrix. Preconcentration techniques and detection systems have been developed, as well as new separation setups to enable multidimensional separation and modification of the separation conditions with new column coatings or buffer additives. To further broaden its applicability, CE can be combined with bioassays like enzyme assays and systematic evolution of ligands by exponential enrichment (SELEX). A summary of these advances in CE from 2018 to 2020 is given in this review. For the works released prior to 2018, there are a lot of tasteful reviews available. A recent review [8] offers a comprehensive discussion of the exciting applications of CE in the analysis of proteins, drugs, metabolites, nucleic acids, and carbohydrates. It also offers a glimpse into potential future directions for enhancing the analysis of single cells and bioparticles. Therefore, the focus of this review was on new and developing developments in the areas of sample preconcentration, developing separation media or coatings, building detectors, and multidimensional separation.

Figure 8: Schematic overflow of non-immobilized tumor cells or tissues, multi-target
anticancer medicines can be quickly screened.
Multidimensional separations
In complex biological sample analysis, one-dimensional separation might not be enough. Consequently, multidimensional CE has been created to improve separation and resolution capabilities.
Schlecht et al. did a beautiful job of using 2D CE to address the CE-MS coupling problems. The first dimension, which employed volatile BGEs for high compatibility with MS and was paired with a UV detector employing the modes of CZE, CIEF, MEKC, etc., was connected to CZE as the second dimension.
It was possible to successfully separate and identify complete monoclonal antibodies (mAb). Additionally, their group created MEKC-CZE-MS for the detection of protein fragments and contaminants, and by analyzing the proteins isolated from soybeans, they were able to demonstrate the system’s adaptability.
However, because of CE’s ultralow sample volume and flow rate as well as the intricate design required to link the pressure-driven separation systems and the electric field-driven CE, linking CE to other separation techniques is not fully simple. Off-line coupling is therefore frequently used.
The first instance of off-line linking capillary electrophoresis (CE) with asymmetrical flow field flow fractionation (AF4) for nanoparticle separation was put out by you and your colleagues. They looked at the separation of a blend of polystyrene nanoparticles (PS-NPs) with similar core diameters (20, 50, and 100 nm) and various charge groups on the surface. Low peak resolution and efficiency were seen with either approach alone, however the 2D off-line coupling of the AF4 and CE system produced separate zones for the
DETECTORS
Mass spectrometry (MS) MS is still a potent CE detector. High detection sensitivity can be achieved by coupling CE to many MS systems through the creation of innovative and efficient interfaces.
Electric currents at the interface between CE and the ESI source of HRMS were regulated by Sasaki et al. using an ESI-MS adapter with a grounded nebulizer. For the investigation of 34 charged metabolites, this sheathless CE-MS connection increased the detection sensitivity and offered good reproducibility and intermediate precision. Additionally, they used human-plasma extract to evaluate their metabolome analysis platform and were able to identify 270 compounds, demonstrating the possibility of screening clinical samples on a wide scale for the identification of biomarkers.
In order to route the liquid flow from the mobility capillary electrophoresis (MCE) separation channel to the MS, Zhang et al. presented a straightforward design that included a reference electrode for the ESI spray and a stainless steel needle at the capillary outlet for the nanoESI emitter. When combined with MS, MCE can disclose the size of globular biomolecules and determine the effective radius of an ion by substituting a steady liquid flow for EOF in separation.
With the LODs for peptides reaching ~1 mg/mL to ~20 μg/mL, under optimal conditions, our design increased the ion signal intensity by approximately 10 times when compared to a commercial nanoESI source. In a similar vein, a novel medium throughput technique for protein analysis was created by coupling MCE with native MS. Ion separation, hydrodynamic radius, and effective charge could all be measured in a single experiment thanks to the integration of Tayler dispersion analysis (TDA), which provides the diffusion coefficient of analytes, into MCE In this piece of work,

Figure 9: (A) New sheathless ionization interface schematic diagram. A) The instrument configuration with the straight nanoESI interface zoomed in. (b) A close-up image of the undistorted nanoESI. A picture showing the unmodified nanoESI MS interface (c). (B) Schematic illustration of the protein conformation and charge state analysis approach based on MCE. (C) Liquid junction chip details in photos and the interface scheme (top).
Holtkamp et al. created a unique PTEE end-cap to transform a coaxial sheath-flow interface intended for connecting CE with ESI-MS into an efficient interface between CE and ICP-MS, thereby improving the usual interfaces between CE and ICP-MS. The position of the retracted capillary inside the sprayer needle, as well as the carrier gas and sheath liquid flow rates, were optimized, allowing the LOD for 190.5Pt to achieve 0.08 μM with better peak quality and sensitivity than the commercially available CE-ICP-MS interface.
In order to enhance neuropeptide coverage, a mass spectrometry imaging (MSI) platform was constructed by combining CE with matrix-assisted laser desorption/ionization (MALDI). Because neuropeptides are not abundant in vivo, this approach uses polyethylenimine (PEI) coating of the capillary to decrease peptide adsorption and LVSS preconcentration of neuropeptides. With good consistency, our continuous sample determination approach found a lot of neuropeptides, indicating that it could replace traditional LC-ESI-MS.
Krenkova et al. show that computer modeling can aid in improving interface design. With the aid of computer modeling, a hybrid liquid junction-based interface was created. It consists of a liquid junction, a brief transport route, and a pointed sprayer that protrudes into the ESI source. Plastic materials can be used in microfabrication processes to create this interface. A variety of tiny peptides, proteins, and tagged oligosaccharides were analyzed using this innovative technique, which has low band broadening, excellent sensitivity, and good separation repeatability.
IEF-ESI-MS has developed into a potent technique for precise proteoform identification and quantification. Xu et al. used an electrokinetically pumped sheath flow CE-MS interface to construct the automatic, online IEF-MS/MS platform. The linear polyacrylamide (LPA)-
coated capillary’s input was placed in an acidic anolyte solution on this platform, and its output was placed in an acidic sheath buffer-filled interface. Following focussing, protons moved from the acidic anolyte and anions from the sheath buffer, progressively disrupting the pH gradient. Understanding the biological processes in the brains of male and female zebrafish was made possible through quantitative study of protein expression.
Additionally, CE-time-of-flight MS demonstrated the suitability of CE-MS for metabolic profiling by quantifying hydrophilic metabolites in 247 participants with varying stages of cancer. Using multisegment injection-CE-MS for high-throughput placental metabolomic analysis with sex-specific variations is another excellent example. Additionally, a few preconcentration techniques, such as LLE for better analysis of the metabolome of mouse plasma and FASI for improved investigation of the metabolome in individual neurons, were coupled to the CE-MS platform in order to lower sample amount and detection limit.
Optical detection
Particularly when combined with optical detection techniques like ultraviolet/visible (UV-Vis), fluorescence, and luminescence detection, the small dimension of the capillary column limits the amount of sample that can be injected, and the short optical path length adds to the low concentration sensitivity of on-column detection for CE. Two well-liked approaches to the CE detection issue are the use of analyte labels capable of producing strong signals or better detector architecture.
For the purpose of fluorimetrically detecting ofloxacin in milk samples, graphene quantum dots (GQDs) with comparatively uniform diameters and exceptional photoluminescence characteristics were used to boost the emission of a fluoroquinolone. Before the material was added, GQDs were injected into the capillary to interact with ofloxacin in a specific way that would allow for its detection using fluorescence. In ideal CE settings, a commercial CE device featuring a multi-wavelength photoluminescence detector might yield LOD and LQD of 10.7 and 35.5 ng/mL, respectively.
investigated CE with UV-excited fluorescence detection for sensitive chiral analysis of amino acids (AAs), using optical fibers to aim the UV light from a Xe-Hg lamp and the fluorescence that was released to a charge-coupled device (CCD). LODs for D-AA enantioseparation ranged from 10 to 100 nM. Additionally, the system was used, with the help of an enhanced sample cleanup process, to evaluate cerebrospinal fluid (CSF). A concave silver mirror was added to an improved fluorescence detection system, which significantly raised the sensitivity of light-emitting diode-induced fluorescence (LEDIF) [81]. The target molecule’s emission was detected by the photomultiplier tube (PMT) after being reflected by the concave silver mirror with greater convergence. This led to a 16-fold increase in detection sensitivity over that which would have been possible without the concave mirror. L-Leu and L-Val, two FITC-labeledtumor markers, were isolated and found in CE-LEDIF, with LODs as high as 150 nM. Furthermore, a low-cost, low-footprint silicon photomultiplier (SiPM) was employed as a reasonably priced, sensitive fluorescence detector [82]. With a dynamic range spanning five orders of magnitude, SiPMs can detect fluorescein as low as 10−12 M, or 10−21 mol. By introducing the commercially available SiPMs, a miniature, portable, and sensitive instrumentation could be achieved for the measurement of enzyme activity in single cells, and it was demonstrated to be capable of providing high sensitivity.
Casto et al. (Fig. 5) [83] devised a unique 3D-printed LED-induced fluorescence detector with an integrated excitation source and optical filters for on-line, dual-point capillary detection. This three-dimensional detector could constantly track the conjugation of bovine serum albumin by fluorescein isothiocyanate, with LODs of 613 ± 13 pM for fluorescein.

Figure 10: showing the new 3D-printed cartridge used to enhance capillary temperature control (B) and a small 3D-printed LED-induced fluorescence detector (A). Essentially, the 3D-printed cartridge consisted of two parts: one that fit inside the CE instrument (a) and another that went toward the ESI source (b), holding the ESI probe (c) in place with a flexible O-ring (d). The first (f) and second C4D (g) were traversed by the silica capillary (e). The microcontroller on the back of b was connected to the electrical wiring (h). The fan’s electrical connection was located in the same compartment (i). The ducts’ interior walls were coated with copper foils (j). Magnets made of neodymium four millimeters (k) were utilized to retain
Chemiluminescence is an additional tool for analyte detection in CE, in addition to fluorescence. Polyvinylpyrrolidone (PVP), zinc oxide nanoparticles (ZnO NPs), tris(2,2′-bipyridine) ruthenium (II), and silica sol-gel were the components of a novel electrochemiluminescence (ECL) detector. Quinapril hydrochloride (QHCl) and its metabolite quinaprilat hydrochloride (QTHCl) had LODs of 3.6 ng/mL and 3.9 ng/mL, respectively, under optimal experimental circumstances. The BGE contained 20% n-propyl alcohol and 14 mmol/L of phosphate (pH 8.0).
Capacitively coupled contactless conductivity detection (C4D)
In order to quantify both inorganic ions and organic substances for use in forensic investigations and potential medicinal advancements, C4D has been widely utilized as a CE detector.
It is possible to combine C4D with additional detectors to provide complementary information. For example, it was used in conjunction with UV detection to track the bioleaching of meteorites by Acidithiobacillusferrooxidans [85] and the hydrolysis of thiol substrates during the conjugation of gold nanoparticles [86]. It was possible to assess food samples combining organic and inorganic components when combined with NACE and MS separation [87]. Within this system, MS’s detection limits for organic biomolecules were limited, but C4D was able to identify inorganic ions.
Two major issues arise when combining the powerful MS with the low-selectivity C4D: how to stabilize the temperature management and enhance the CE separation performance of the thermally unstable chemicals. Therefore, a new cartridge was created via 3D printing to enhance CE’s temperature management. The cartridge can hold up to two C4D devices, forming CE-(C4D)2-ESI-MS/MS in an environment where the thermal energy produced by Joule heating is properly dissipated. The thermally unstable species monoethyl carbonate was separated with good peak shape, resolution, and repeatability.
Wang et al. corrected the peak shape distortion and optimized the double-input (DI) C4D structure for use in inorganic ion analysis by CE. DIC4D demonstrated a solid linear connection, lower baseline, higher sensitivity, and lesser noise as compared to regular C4D.
Miscellaneous
Over the time span of this review, a number of novel detection technologies have also been developed. One interesting method is to use a microfluidic cell to connect CE with surface plasmon resonance (SPR) in order to quantify the affinity of antibody-antigen and enzyme-inhibitor binding in protein mixtures [90]. The ground electrode in this instance was the SPR biosensor.
Previous approaches to linking CE with electrochemical sensing revealed problems including fragility or non-market availability. In order to combine CE with electrochemical detection, Kimlinger et al. introduced a wall-jet electrode device that was 3D printed [91]. Analytes were eluted by pressure following separation, which decreased baseline noise in comparison to the conventional end-column detection method. This method was able to separate a combination of catecholamines, and it also showed how easily a commercial CE device could be integrated with the 3D electrode.
Furthermore, Nowak et al. provided proof of concept for the simple coupling of microscale thermophoresis (MST) to CE in an on-line flow system [92]. Samples were electrophoretically separated and then put straight into the MST apparatus to undergo thermophoretic analysis. During the measurement process, the EOF was temporally stopped. This system could be further applied to provide reliable data for measurement of ligand binding and molecular interactions, features unavailable for the current CE techniques. Furthermore, CE-MST coupled with MS is feasible by inserting the capillary outlet into the MS detector and using the MS-compatible buffers for thermophoretic analysis.
APPLICATIONS
It is possible to simultaneously determine the ions NH4+, Na+, K+, Mg2+, and Ca2+ in saliva using capillary electrophoresis.
The creation of techniques for the amplification and detection of DNA fragments using polymerase chain reaction (PCR) is one of the primary uses of CE in forensic research. This work has resulted in swift and significant advancements in forensic DNA analysis. Thin CE 50-mm fused silica capillaries loaded with a sieving buffer are utilized for DNA separations. Because of these capillaries’ superior heat-dissipating properties, electric field intensities far higher than those of slab gel electrophoresis can be employed. As a result, capillary separations are quick and effective. Furthermore, the capillaries are simple to replace and refill for effective, automated injections. Fluorescence is used for detection through a window etched into the capillary. There are capillary-array and single-capillary devices available with array systems that can run 16 or more samples at once for higher throughput.
Forensic scientists mostly utilize CE for STR typing from biological materials, which produces a profile based on highly polymorphic genetic markers that vary throughout individuals. The identification of particular mRNA fragments to assist in determining the biological fluid or tissue origin of a forensic sample is one of the additional emerging applications for CE.
CE is also used in forensics for ink analysis, wherein the analysis of inkjet printing inks is becoming more and more important because of the growing frequency of document counterfeiting using inkjet printers. When it comes to forged documents and fake banknotes, the chemical makeup of inks offers crucial information. One technique that has been developed and used for the examination of inks extracted from paper is micellar electrophoretic capillary chromatography (MECC). Its strong resolving power allows for the distinction of variations between inks made by the same manufacturer, even when those inks contain many chemically identical compounds. This makes it appropriate for using the chemical makeup of inks to determine the provenance of documents. It is important to note that the differentiation of inks based on their MECC electrophoretic profiles is a more reliable method for determining the ink cartridge of origin (its producer and cartridge number) than the printer model of origin, due to the possibility that the same cartridge will work with different printer models.
A specific kind of CE called affinity capillary electrophoresis (ACE) makes use of intermolecular binding interactions to comprehend connections between proteins and ligands.[17] ACE is utilized by pharmaceutical companies for various purposes, one of which is to determine the association/binding constants between medications and ligands or between drugs and certain vehicle systems, such as micelles. The approach is commonly employed due to its ease of use, quick outcomes, and minimal analyte consumption.[18] It has been demonstrated that using ACE can offer precise information on the binding, separation, and detection of analytes and is very useful for life science research. Modified aptamers ideally exhibit high binding affinity, specificity, and nuclease resistance.[19] Ren et al. incorporated modified nucleotides in aptamers to introduce new confrontational features and high affinity interactions from the hydrophobic and polar interactions between IL-1α and the aptamer.[20] Huang et al. used ACE to investigate protein-protein interactions using aptamers. A α-thrombin binding aptamer was labeled with 6-carboxyfluorescein for use as a selective fluorescent probe and was studied to elucidate information on binding sites for protein-protein and protein-DNA interactions.
Capillary electrophoresis (CE) has become an important, cost-effective approach to do DNA sequencing that provides high throughput and high accuracy sequencing information. Woolley and Mathies used a CE chip to sequence DNA fragments with 97% accuracy and a speed of 150 bases in 540 seconds.[22] They used a 4-color labeling and detection format to collect fluorescent data. Fluorescence is used to view the concentrations of each part of the nucleic acid sequence, A, T, C and G, and these concentration peaks that are graphed from the detection are used to determine the sequence of the DNA.
CONCLUSION AND OUTLOOKS
Because of its adaptable separation platforms and ease of integration with separation medium and additives, CE, despite being a well-established separation technique, keeps developing to benefit a variety of analytical and bioanalytical investigations. This evaluation is by no means comprehensive enough to include every work on CE that was published between 2018 and 2020. To give a current picture of the state-of-the-art development in the field, we have instead chosen to highlight a few special developments that are typical of the major trend of growth in CE methodologies and instrumentation.
Considering all of these previous tasteful attempts to progress CE, we expect further developments in
In the future, advancements in CE instrumentation may also make CE platforms more accessible and enable CE applications to be implemented economically in labs with minimal resources. For instance, less expensive, specially designed CE equipment have been created for these uses For the successful isolation of intact sperm cells for quantitative PCR analysis of male DNA and the successful determination of bacteria from a complex microbiome by downstream culturing and sequencing, CZE with an automated fraction collector that holds microtiter plates and even Petri dishes was created. As 3D printing and microfabrication continue to progress, simpler and more portable CE devices will be created.
Hami Medical Group