Hematology Analyzers Advancing Precision in Blood Cell Analysis
IntroductionOther Section
The modern hematological analyzers are easy to use and can process several blood samples in a short period of time (e.g., 120 samples/h) . The latest generation of hematological analyzers can also generate accurate results. However, abnormal spurious results can be observed for the leukocyte count, platelets count, nucleated red cells count, haemoglobin, red cell indices and reticulocytes . Usually, these analyzers are used for carrying out the cell count and the differential leukocyte analysis. However, they can also provide additional information relevant to clinicians. A better knowledge of the potential of these instruments and their limits is therefore crucial. In this paper we present some examples of the potential diagnostic information that the hematological analyzer can provide.
Hematological analyzers: history of an evolving technologyOther Section
Cell analysis of hematological analyzers relies on two principles: (I) electrical resistance or impedance and (II) optical analysis. The principle of impedance was formally first used by Coulter in 1949 and has enabled cytometers to count and measure the volume of analyzed cells .
This method was further perfectionated thanks to the following improvements: hydrodynamic focusing, correction for coincidence, recognition and elimination of abnormal signals, use of lysing agents selective for specific leukocyte populations. In 1968, the production of the Coulter Model-S© with sampling valve and automatic correction for coincidence, revolutionized the activity of hematological laboratories .
A similar method, based on capacitance- rather than resistance-measurements, was developed in the 1950s in Japan and became the basis for the first analyzers commercially produced by TOA (now Sysmex, Kobe, Japan) .
A further extension of Coulter’s principle consisted of the contemporary use of low and high frequency current to examine different cell characteristics: the size in the first case and the composition and internal structure in the latter. These bi-parametric measurements were commercially applied in 1986 first with the volume, conductivity and scatter (VCS) transducers produced by Coulter and in 1988 with the NE series of analyzers produced by Sysmex .
In flow cytometry the optical method was developed before the impedance method. The first application by Moldavan dates to 1934 .
In 1953, the use of dark field analysis and the introduction of sheath flow by Crosland-Taylor were two fundamental steps for obtaining relatively accurate cell counts . Following these developments, the first commercial instruments based on optical method to perform the blood cell counts were finally produced.
The amplitude of scattered light collected at narrow angle (forward scatter) was found to correlate to the cell volume, while the refraction index at greater angles was associated with the cellular structural complexity.
In early ’60, Kamentsky et al. built the “Rapid Cell Spectrophotometer”, the first flow cytometer capable to evaluate a cell volume measurement based on scattering and absorbance. In 1974, the combined use of these two methods was commercially applied by Technicon (now Siemens, Erlangen, Germany) in the Hemalog-D© instrument, which was able to perform the complete differential leukocyte count .
The red blood cell (RBC) volume measurement using optical method was influenced both by the erythrocyte biconcave discoidal shape and the different refraction index of each cell [depending on hemoglobin (Hb) concentration] .
The last two decades have been characterized by the application of fluorescence measurements using dyes for specific cell components (i.e., the nucleic acids), or, less frequently, dyes bound to monoclonal antibodies. Currently, the fluorescence measurements are only qualitative or semiquantitative and are utilized by some manufacturers (Abbott, Wiesbaden, Germany; ABX-Horiba, Kyoto, Japan; Sysmex) to obtain the reticulocyte and erythroblast counts or in some cases the differential leukocytes or platelet counts .
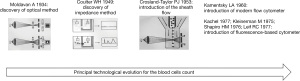
The historical chronology of the principal technological evolution of haematological instrumentation is shown in Figure 1.
Red cell diseases and diagnosisOther Section
Erythrocytes abnormalities and defects are frequently found in clinical laboratory medicine. Several authors have attempted to simplify diagnosis by using information offered by hematological analyzers. Already in 1989, Pati et al. reported the advantages of the Technicon H1-analyzerTM (now Siemens) for the diagnosis of hereditary spherocytosis (HS), using the means of mean corpuscular hemoglobin concentration (MCHC) and red blood cell distribution width (RDW) measured by this instrument. Spherocytes were recognizable in the H1 histograms of cell size and Hb concentration as distinctive microcytic and hyperchromic tails .
More recently Sugandha et al. reported the utility of RBCs data (percentage of hyperchromic cells, hyperchromic cell flagging, and RBC cytogram pattern) generated by the Advia-120TM hematology analyzer (Siemens) as a potential screening tool for HS . Furthermore, Rooney et al. reported that the measurement of hyperchromic erythrocytes is highly sensitive and specific for detecting HS in children using the hematology analyzer Cell-Dyn Sapphire (Abbott) .
In addition, Nivaggioni et al. recently even suggested a “decision tree” algorithm based on erythrocytes and reticulocytes parameters obtained by Sysmex XN-series hematology analyzers. This was able to facilitate the diagnosis between HS and iron deficiency anemia (IDA) . Nivaggioni et al. created a flow chart for the classification of hereditary RBCs diseases, with a sensibility and specificity for RBC diseases detection of 95.2% and 99.9% respectively . The following parameters were used for this: (I) the MCHC, (II) percentage of microcytes, (III) RDW, (IV) percentage of nucleated RBCs and (V) immature reticulocytes fraction.
The same authors proposed afterwards a complementary decision three for the detection of Southern Asian Ovalocytosis . Mullier et al. proposed an algorithm for the identification of HS. This tool uses RBCs and reticulocytes parameters provided by the automated hematological analyzers such as the reticulocytes to immature reticulocytes fraction ratio, the percentage of micro-reticulocytes, the ratio between micro-reticulocytes and reticulocytes with low Hb levels . It is important to stress that this algorithm was included in the 2015 International Council for Standarization in Haematology Guidelines for the laboratory diagnosis of erythrocytes cell membrane disorders . Several other authors validated the algorithm proposed by Mullier with adjusted cut-off according to patient cohort type .
Urrechaga et al. suggested to use automated measurement of RBC subpopulations to screen efficiently between patients with microcytosis from those with β-thalassemia . According to these authors, the use of formula based on the percentage of hypocromic RBC, the percentage of microcytic RBC and RDW can efficiently screen subjects with microcytosis who require further hematological studies to confirm β-thalassemia (sensitivity 100%, specificity 92.6%) . Few years before, the same author, reported on the possibility of using an index obtained with the Advia-2120TM (Siemens) (% microcytic/% hypochromic ratio index) to differentiate between microcytic anemia and beta-thalassemia with an excellent rate of success . In another study the author evaluated the clinical utility of the “low haemoglobin density”, a new parameter provided by Beckman-Coulter LH750TM (Fullerton, CA, USA) analyzer for the diagnosis of iron deficiency. The conclusion of this study was that this new parameter can determine iron deficit with a specificity and sensibility of 93.3% and 95.2% respectively . The parameter low haemoglobin density in addition to some new red cell parameters (RBC size factor, microcytic anaemia factor, standard deviation of conductivity of the non-reticulocyte population and unghosted cell) provided by Beckman Coulter DxH800TM analyzer has been evaluated by Ng et al. The conclusion of these authors was that the new RBC parameters on Beckman Coulter DxH800© provide valid information in distinguishing between IDA from thalassemia trait .
In 2012, another algorithm derived from extendend RBC parameters provided by the Sysmex XE5000TM analyzer such as percentage of hyprochromic and microcytic RBCs and Hb content of reticulocytes was proposed as laboratory anemia screening devices . Table 1 summarizes some of the main works performed by the various authors to facilitate the diagnosis of red cell abnormalities and diseases.
Cold agglutinin and analyzersOther Section
The presence of cold agglutinins is often a random laboratory finding associated with difficulties in performing complete blood count (CBC) with a spurious increase in the MCHC and decrease in the RBCs. Several methods have been used to inhibit the interference of cold agglutinins with the analyzer. The most widely used consist in incubating the blood sample in a hot water bath at 37 ℃ for 2 hours. Recently, our group evaluated the possibility to use the reticulocyte channel on the XN-analyzer, heated to 41 ℃, to analyze samples with cold agglutinins. Furthermore, CBCs obtained in reticulocyte channel were compared to those obtained with the traditional impedance method for the RBCs count on the XN analyzer after preheating samples to 37 ℃ for 2 hours. The conclusion of the authors was that reticulocyte channel can rapidly and efficiently correct the RBC count, without the need to preheat samples with cold agglutinins. Nevertheless, this cannot completely solve the residual presence of cold agglutinins in all samples . These observations are in line with the conclusions of several other previously published papers, that evaluated the possibility of adjusting erythrocytes agglutination using the reticulocytes channel of the hematological analyzers .
Modern analyzers in the diagnosis of myelodysplastic syndrome (MDS)Other Section
The modern hematology analyzers automatically provide, new data defined “cell population data” (CPD). These data are only for research purpose.
A very recent application of modern analyzers adopting new CPD parameters was used to identify patients with MDS, among subjects with normal CBC.
Kim et al. showed that CPD representing cell volume (decreased neutrophil forward scatter light) and complexity of neutrophils (decreased neutrophil side scatter light) may be useful for screening MDS using peripheral blood (PB) . The existing known markers, low RBC count and platelet count, showed highest diagnostic efficiency in screening MDS rapidly without additional cost .
Since the diagnosis of MDS is based on the interpretation of bone marrow morphology, the detection of PB abnormalities in MDS by using an automated analyzer would be extremely helpful . Unfortunately, a recent publication by Murphy and colleagues on the use of CPD to differentiate patients with MDS and those with other forms of anemia, did not found statistically significant difference in CPD parameters between patients with MDS and those with other normochromic anemias . Therefore, more studies are needed to validate CPD data for the diagnosis of MDS patients.
Microbiology and hematological analyzersOther Section
Additional information provided by modern hematological analyzers can be very useful for microbiologist. For example, several authors reported cases of Pseudo-erythroblastosis identified with the hematology analyzer caused by Candida sepsis. The presence of Candida albicans blastospores in the PB, determined morphological anomalies on cytogram of modern hematological analyzers provided by different companies, extended from the noise to close the nucleated RBCs zone, generating a result of Pseudo-erythroblastosis . These represent other practical example of how “zero-cost data” might be useful, once correctly interpreted, for the identification of fungal infection. The clinical repercussions on the management of the patient are therefore relevant.
In keeping with this, the presence of Toxoplasma in the PB was recently identified by a hematological analyzer, thanks to the alarm related to the presence of erythroblasts . The scattergram related to the channel WNR (WBC and nucleated red blood cells) showed an abnormal cluster in the zone normally associated with erythroblasts. In this case, the cluster was generated by the presence of Toxoplasma, subsequently confirmed by microscopic examination .
Similarly, Roccaforte et al. described an interesting case of unexpected diagnosis of Plasmodium falciparum. The investigation was triggered because an abnormal cellular cluster in the scattergram relative to the white blood cell differential (WDF) channel of blood count on XN-analyzer . Optical microscopy was performed and showed that the abnormal cluster was consistent with parasitized blood cells.
This study confirms previous results obtained with the different hematological analyzers from Beckmann-Coulter and Abbott, and also underlines the possibility to identify subjects with malaria thanks to the abnormalities observed in cellular scattergrams provided by different hematological analyzers .
Inflammation or infectionsOther Section
Modern hematology analyzers can also efficiently differentiate between inflammation and infection. Changes in neutrophils, lymphocytes and monocytes are observed in the course of infection and inflammation. However, identifying these morphological changes is often complex and laborious. In 2011, Park et al. determined the utility of leukocyte CPD for the screening of sepsis and fungemia using Beckman Coulter DxH800TM. The authors showed that many of the CPDs of neutrophils, lymphocytes, and monocytes can be considered useful sepsis-parameters. These parameters can be incorporated into a decision rule for the screening of sepsis samples and to discriminate fungemia from bacteremia . Very recently, Aguirre et al. reported the diagnostic performance of a machine learning model using CPD provided by the Mindray BC-6800-PlusTM analyzer for the detection of sepsis. The author’s conclusion was that CPD data can be useful at patient admission time for establishing a cost-effective sepsis prediction . Urrechaga et al. explored the leukocyte differential and CPD parameters reported by the Mindray BC-6800-PlusTM analyzer in patients infected with severe acute respiratory syndrome coronavirus 2 (SARS-CoV-2) and those suffering from infections of different etiologies admitted to the emergency department. The conclusion of these authors was that among CPD, the neutrophils-derived parameters are useful for the discrimination between SARS-CoV-2 and other infections .
Interestingly, after the first cases of coronavirus disease 2019 (COVID-19) several studies used the CPD data for a timely diagnosis of the disease with the intent of monitoring, and to help establish the prognosis and disease severity. However, CPD values largely depend on analyzer type and CPD from different analyzers are not necessarily comparable, hindering the widespread of these parameters . Therefore, further studies are needed to confirm these early encouraging findings.
Recently, Polilli et al. presented a study on monocyte distribution width (MDW) a parameter provide by the UniCel DxH800TM (Beckman Coulter) instrument, that may play a role in identifying patients with sepsis in comparison with procalcitonin. This study showed how the use of MDW together with routine WBC counts and indices may be of remarkable use to detect sepsis .
ConclusionsOther Section
In conclusion, modern hematological analyzers can provide information that goes beyond just the simple counting and differentiation of blood cells. Laboratory specialists should become aware and familiarise with the potential offered by the current instruments. We believed that if these laboratory data are incorporated into well-designed clinical studies, they would certainly contribute to better clinical patient management.